

Bitcoin realized price reveals something conventional price charts often miss: investors do not experience the same market at the same price. A recovery that looks encouraging to one holder may offer another the first opportunity to exit without a loss. When enough investors share similar acquisition costs, their decisions can create selling pressure even without an obvious technical barrier. The deeper question is not whether Bitcoin is recovering, but whose financial position that recovery is improving and what they choose to do with it.
Unlike indicators focused on current trading activity, realized price estimates the cost basis embedded across Bitcoin’s existing supply.
That distinction becomes important when Bitcoin approaches levels where large groups of holders may be looking to recover their initial investment.
October 2026 offers a useful example.
Bitcoin has traded substantially above its aggregate realized price, yet investors who acquired coins during different periods face different profitability conditions.
Some older holders retain considerable unrealized gains, while more recent buyers remain more sensitive to changes in price.
Earlier October trading showed repeated attempts to establish higher prices encountering selling interest, even as the broader market remained profitable on an aggregate realized-price basis.
This illustrates an important structural imbalance.
A market can appear healthy overall while the investors actively supplying coins face different incentives from those who continue holding.
The distinction matters because market prices respond to actual transactions, not simply the profitability of coins that remain inactive.
What Bitcoin Realized Price Actually Measures
Bitcoin’s realized price is calculated by dividing its realized capitalization by its circulating supply.
Realized capitalization differs from conventional market capitalization.
Traditional market capitalization values the circulating supply using Bitcoin’s current market price. Realized capitalization generally values unspent transaction outputs according to Bitcoin’s price when those coins last moved on-chain.
The resulting figure provides an estimated aggregate cost basis for Bitcoin’s circulating supply.
When Bitcoin trades above its realized price, the network’s supply collectively has an unrealized gain under this accounting method. Below that level, aggregate unrealized profitability turns negative.
However, realized price is not a precise record of what every investor paid.
Coins can move between wallets controlled by the same entity, while custodial transactions may occur without equivalent on-chain movements. A transfer also does not necessarily represent a purchase or sale.
Derivatives positions can change investors’ economic exposure without moving the underlying Bitcoin.
Realized price estimates the cost basis recorded by coin movements, not the exact purchase price of every investor. Its greatest value comes from identifying broad profitability conditions rather than treating individual readings as precise records of ownership.
The more revealing question is how profitability is distributed.
Two markets can have similar aggregate realized prices but very different underlying conditions.
One may contain substantial recently active supply sitting near break-even. Another may be dominated by older holdings carrying considerable unrealized profits.
Those differences influence how holders respond to changing prices.
An investor sitting on a substantial gain can absorb a moderate decline without moving into a loss. Someone approaching break-even after months underwater may have less willingness to tolerate another correction.
Realized price therefore provides a starting point for examining the financial position of Bitcoin’s supply. Holder-cohort data adds context about where potential selling incentives may be concentrated.
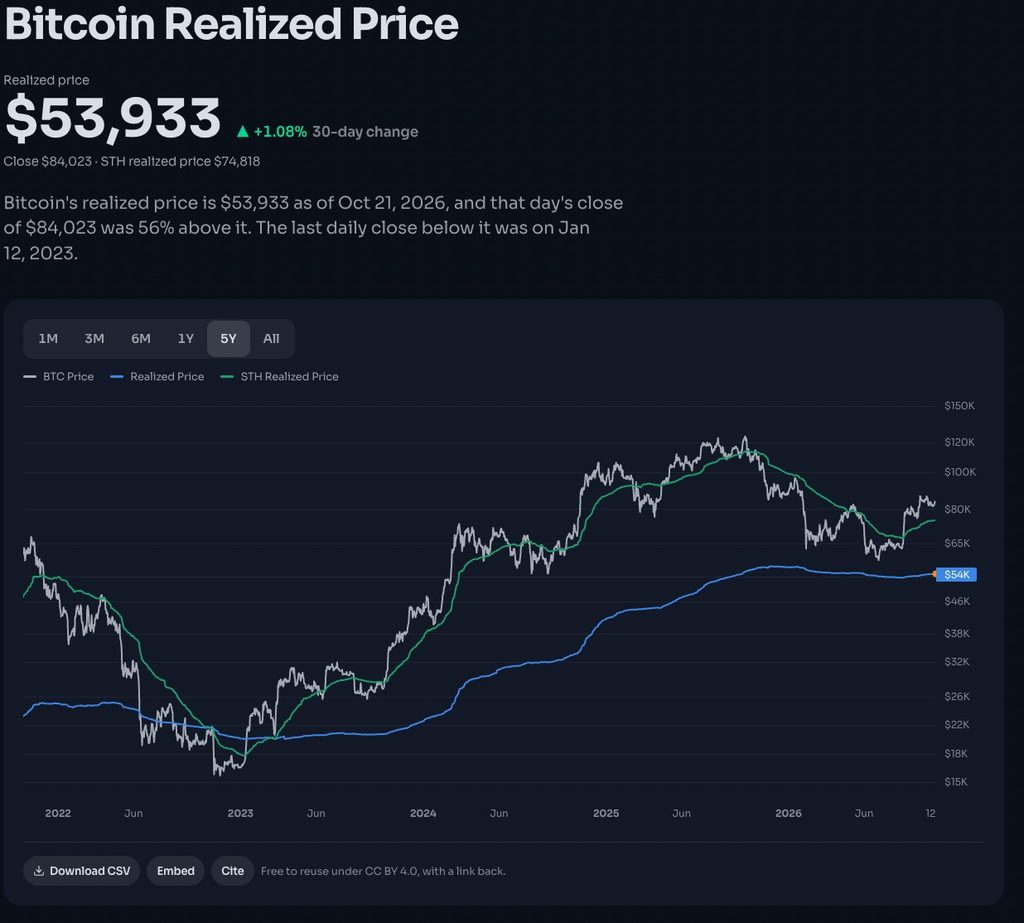
The Bitcoin realized-price chart illustrates the gap between market value and investor cost basis. On October 20, BTC closed near $82,946, compared with an aggregate realized price of approximately $53,904 and a short-term holder realized price near $74,684, according to Explore21. The difference shows that Bitcoin’s supply was profitable on average, but it does not reveal which investors were prepared to sell. That requires examining actual spending behaviour and available market liquidity.
Why Investor Cost Basis Can Create Selling Pressure
Investors do not make selling decisions based exclusively on market forecasts.
Their entry price can influence how they respond to volatility, particularly after holding an asset through an extended period of losses.
Consider an investor who purchased Bitcoin at $90,000 before watching its price decline to $75,000.
If Bitcoin subsequently recovers toward $90,000, that investor faces a different decision from someone who acquired coins at $40,000.
The first may view the recovery as an opportunity to exit without a significant loss. The second may remain comfortable holding because the position is still profitable.
Neither response is guaranteed. Some investors accumulate while underwater, while profitable holders may sell aggressively.
But when many investors share similar acquisition prices, their individual decisions can create a concentration of potential selling interest.
The mechanism becomes clearer when considering how prolonged losses influence behaviour.
An investor who originally purchased Bitcoin expecting further appreciation may gradually shift toward protecting capital after months of unrealized losses.
As the position approaches break-even, exiting becomes financially and psychologically easier.
That supply can emerge precisely when market sentiment is improving.
A recovery does not need fresh bearish sentiment to fail. Sometimes it simply reaches the price where existing holders are willing to leave.
This behaviour can explain why a seemingly constructive price recovery encounters resistance without a corresponding deterioration in market news.
However, acquisition-cost concentration is only one part of the mechanism.
Potential sellers must actually place orders, and their effect depends on how much buying interest is available.
If demand absorbs the offered supply, Bitcoin can move through a concentrated cost-basis region without significant disruption.
If sellers cannot find sufficient buyers at prevailing prices, transactions may occur at progressively lower prices until enough demand emerges.
Cost basis identifies a possible source of supply. Actual spending and execution determine whether that supply reaches the market.
Why Institutional Execution Changes the Picture
Large market participants introduce an important distinction between the willingness to sell and the way selling occurs.
A retail investor may close an entire position through a single market order. An institution managing substantial exposure must consider execution costs, available market depth, and the impact of revealing a large order.
Rather than immediately selling its full position, a large holder may distribute exposure through smaller transactions, passive limit orders, or algorithmic execution.
This can spread selling activity across multiple trading sessions and allow orders to interact with incoming demand.
A concentrated cost-basis region may therefore produce persistent selling interest without a single unusually large transaction.
The impact also depends on order-book depth.
Selling 1,000 BTC into a market with substantial resting buying interest can produce a different outcome from selling the same amount when available liquidity is limited.
The quantity being sold matters, but so does the market’s capacity to absorb it. This relationship is also evident in Bitcoin liquidity depth, which helps explain why similar amounts of selling can produce different price reactions depending on the buying interest available.
Derivatives introduce another limitation.
Institutions can reduce directional Bitcoin exposure through futures or options without necessarily transferring their underlying spot holdings.
Such transactions can change market positioning while leaving on-chain realized capitalization largely unaffected.
Similarly, institutional spot distribution may occur gradually enough that no single transaction fully reflects the participant’s broader decision.
This makes it difficult to establish selling intentions from realized price alone.
The indicator describes the estimated acquisition history of coins. It does not reveal pending institutional orders, execution strategies, or off-chain derivatives exposure.
Cost basis explains why supply may appear. Liquidity determines what happens when it does.
Why Short-Term and Long-Term Holders Respond Differently
Aggregate realized price provides a broad picture of Bitcoin’s profitability, but it conceals important differences between investor groups.
On-chain analysis commonly separates Bitcoin into short-term and long-term holder cohorts using an approximately 155-day threshold.
Short-term holders generally represent coins that have moved within the previous 155 days, while long-term holders represent coins that have remained unmoved for longer.
The classification depends on coin-age measurements or entity-adjusted activity, according to the methodology used. Some models apply a gradual transition rather than a strict cutoff.
These categories do not directly identify investor intentions or establish exact acquisition dates.
Nevertheless, they help distinguish recently active supply from coins that have remained inactive for longer periods.
Short-Term Holder Realized Price
Short-term holder realized price estimates the acquisition cost of more recently active supply.
Because these coins have moved relatively recently, their cost basis tends to respond more quickly to changes in Bitcoin’s market price.
When Bitcoin falls below this level, the cohort’s average position moves into an unrealized loss under the metric.
However, short-term holder realized price represents an estimated cohort average, not a uniform break-even level for every recently active holder.
Some participants may remain profitable even when the cohort average is underwater. Others may hold losses while the average remains profitable.
The distinction is important because investors within the same cohort can respond differently to a recovery.
Those who acquired Bitcoin near recent highs may seek to reduce losses. Others who purchased at lower prices may use the same recovery to protect profits.
A concentration of recently active supply can therefore create selling interest for more than one reason.
Short-term holders also include participants whose positions were established under relatively recent market expectations.
When those expectations weaken, investors may reassess whether maintaining exposure still justifies the risk.
A sustained recovery above short-term holder realized price can indicate improving profitability conditions, particularly when accompanied by continued demand.
A brief crossing provides less evidence because the cohort average does not establish how its individual members are trading.
Long-Term Holder Realized Price
Long-term holder realized price reflects the estimated cost basis of older, less frequently moved coins.
These holders often have lower average acquisition prices following prolonged market appreciation, although that relationship changes across cycles.
Their selling incentives can differ considerably from those of short-term holders.
Rather than seeking to escape losses, long-term holders may distribute Bitcoin to realize gains, rebalance portfolios, or meet liquidity requirements.
This means profitable supply can contribute to selling pressure without any deterioration in the holder’s original investment thesis.
For larger investors, selling may reflect portfolio rules rather than a bearish assessment.
An institution with a target Bitcoin allocation may reduce its holdings after significant appreciation because the position has become too large relative to other assets.
An individual holder may sell for expenses or obligations unrelated to Bitcoin’s outlook.
These distinctions matter when interpreting older coins returning to circulation.
A long-term holder transfer may indicate distribution, but coin age alone cannot establish whether the activity reflects profit-taking, risk management, an operational transfer, or another purpose.
What October 2026 Reveals About Bitcoin’s Cost Basis
Recent on-chain observations illustrate why aggregate realized price alone is insufficient.
According to Explore21’s Bitcoin realized-price data, Bitcoin closed October 20, 2026, near $82,946.
Its aggregate realized price stood at approximately $53,904, placing Bitcoin about 54% above the estimated network cost basis.
The short-term holder realized price was approximately $74,684, meaning Bitcoin traded roughly 11% above the average cost basis of recently active coins.
These figures describe estimated cohort profitability, not the exact unrealized gains or losses of every individual investor.
They also reveal a distinction between profitability and active selling behaviour.
Earlier October trading saw Bitcoin encounter resistance around the $85,000 to $87,000 region, even though the average short-term holder position remained profitable.
On October 2, Bitcoin moved through a concentration of sell orders near $85,000 and briefly traded above $87,000. Market observations showed that some resting offers were filled while others were withdrawn.
The subsequent difficulty sustaining higher prices illustrates how quickly available supply and demand can change around a heavily traded region.
A separate on-chain observation offers more direct evidence of recent-holder behaviour.
On October 4, short-term holders transferring coins at a profit accounted for approximately 86% of Bitcoin sent to exchanges, according to Glassnode’s October 2026 market research.
Although exchange deposits do not necessarily result in immediate sales, the concentration shows how recently active holders can become an important source of potential supply during a recovery.
The figure describes one day’s exchange-transfer activity. It does not mean short-term holders accounted for 86% of completed Bitcoin sales, nor does it establish a persistent trend.
Its significance is behavioural.
Investors do not need to be underwater to become willing sellers.
Some recent buyers may distribute into strength because the available profit is attractive relative to the risk of continued exposure.
Others may hold because their expectations remain unchanged.
The October 20 data therefore presents two different observations.
Bitcoin was profitable on average according to realized-price measures, while earlier October exchange activity showed substantial profit-taking-related transfers from recently active holders.
The relationship demonstrates why aggregate profitability cannot independently establish market strength. Bitcoin’s rejection near $83,000 offers a related market example, illustrating why a price recovery must be evaluated against the buying demand available to sustain it.
The average position of a cohort may be profitable even as a particular group within it increases potential selling supply.
Determining whether that activity creates lasting resistance requires evidence from completed trading and the market’s ability to absorb it.
Historical Evidence: Why Realized Price Is Not a Guaranteed Market Floor
Bitcoin’s 2022 bear market provides a useful historical example of the limitations of realized price.
During the downturn, Bitcoin fell below its aggregate realized price as investor losses increased.
May and June 2022 featured substantial realized losses, coinciding with broader deleveraging and distress across highly leveraged market participants.
The decline demonstrated that aggregate investor losses were insufficient to prevent further selling.
The explanation lies partly in the distinction between voluntary and forced transactions.
An investor facing a substantial unrealized loss may prefer to wait for a recovery.
A leveraged participant approaching liquidation may have no such flexibility.
Similarly, institutions experiencing funding problems or companies facing immediate liquidity requirements may need to reduce Bitcoin exposure regardless of their original acquisition prices. Bitcoin miner selling pressure illustrates a related mechanism, where operating expenses and funding requirements can create selling incentives independently of Bitcoin’s estimated investor cost basis.
Forced selling responds to collateral requirements, financing constraints, and available liquidity rather than a preferred valuation.
When leverage is unwound, participants may accept increasingly unfavorable execution prices to meet obligations.
As a result, Bitcoin can continue declining below aggregate realized price even when a growing proportion of its supply is underwater.
The historical contrast emerged during the subsequent recovery.
Bitcoin reclaimed its aggregate realized price in January 2023. Explore21’s historical daily-close series identifies January 12, 2023, as the last daily close below that measure through October 20, 2026.
That sustained relationship highlights the indicator’s usefulness as a long-term reference, but it does not establish an unconditional support level.
The underlying market environment determines how meaningful the relationship becomes.
Investors who can maintain positions through volatility have greater flexibility over when they sell.
Participants facing margin calls, funding obligations, or liquidity shortages may not.
Cost-basis levels become less dependable when sellers cannot delay execution.
Why Cost-Basis Resistance Can Change Without a Major Price Breakout
One overlooked feature of realized price is that the underlying cost basis can change even when Bitcoin’s market price makes little progress.
When coins previously moved at higher prices are transferred during a period of lower valuations, their assigned realized value may fall.
When older coins previously moved at lower prices are transferred while Bitcoin trades higher, their realized value may increase.
Changes in the composition of holder cohorts can also alter their respective cost-basis averages.
This means the financial structure behind a price level is not permanently fixed.
Consider a group of investors holding Bitcoin acquired near $90,000.
If some gradually sell during a prolonged period of lower prices, their coins may transfer to buyers with lower acquisition costs and different risk tolerances.
A future recovery toward $90,000 could therefore encounter a different population of holders from an earlier attempt.
The original investors seeking to exit at break-even may no longer control the same quantity of supply.
However, new holders may also choose to take profits at that level.
Resistance does not necessarily disappear. The underlying motivation for selling may change.
This process matters because ownership can evolve during an extended trading range.
Coins may gradually transfer from participants operating under earlier market expectations to buyers entering under different conditions.
The chart may show little directional progress even while the distribution of cost bases changes.
A price level can remain unchanged while the investors defending or selling it are replaced.
This is one reason repeated tests of similar prices do not always produce similar outcomes.
But an important distinction remains.
On-chain movements are not always transfers between different beneficial owners, and investors can adjust directional exposure through derivatives without moving their Bitcoin holdings.
Changes in realized capitalization or cohort cost bases therefore require interpretation alongside genuine spending activity and broader positioning data.
A sideways market can undergo meaningful changes in ownership and risk exposure, even when those changes are not immediately apparent from price alone.
What Realized Price Cannot Tell Investors
Despite its usefulness, Bitcoin realized price has five important limitations.
First, it cannot identify individual investor intentions. A holder approaching break-even may sell, continue holding, or accumulate additional Bitcoin.
Second, on-chain transfers do not necessarily represent changes in beneficial ownership. Wallet reorganizations and custodial activity can alter recorded coin movements without equivalent economic transactions.
Third, realized price does not directly measure order-book liquidity. It cannot establish how much Bitcoin buyers are prepared to absorb at prevailing prices.
Fourth, it cannot independently distinguish voluntary selling from forced liquidation or operational transfers. These activities have different motivations and potential market consequences.
Fifth, it cannot determine whether a price recovery is supported by durable spot demand. Rising prices can reflect several different forms of buying, including short covering and temporary positioning adjustments.
These limitations do not make realized price irrelevant.
They establish the boundaries of what the indicator can reliably explain.
A more complete assessment considers realized profit and loss, holder-cohort spending, spot trading activity, available market liquidity, and derivatives positioning.
Together, these measures help distinguish the financial incentives facing Bitcoin holders from the transactions actually influencing market prices.
What Investors Should Watch Next
The most informative evidence comes from Bitcoin’s behaviour around important holder cost-basis levels, particularly when combined with changes in spending activity.
Three relationships deserve attention.
First, behaviour around holder cost-basis levels. Repeated rejections near a cohort’s estimated acquisition price can indicate that selling is exceeding available demand. Sustained trading above that region provides stronger evidence that the market is absorbing the supply reaching it.
Second, changes in realized profits and losses. Increasing realized gains may indicate that profitable holders are spending more coins, while rising realized losses can reveal distribution from underwater positions. Both measures require transaction-volume context because declining activity alone can reduce recorded realized losses.
Third, demand following a reclaim. An initial recovery may reflect short covering or a temporary reduction in selling. Continued spot buying and sustained absorption of available supply provide more meaningful evidence of demand beyond the initial move. Recent Bitcoin and Ethereum ETF outflows provide additional context for institutional demand, showing why price recoveries should be evaluated alongside actual investment flows rather than assumed to reflect sustained capital inflows.
These signals address separate parts of the market process.
Cost-basis levels identify where holder incentives may change. Realized spending reveals whether coins are moving at gains or losses. Trading conditions show whether buyers can accommodate the resulting supply.
A brief breakout and a sustained recovery can look similar during their initial stages.
The distinction becomes clearer through subsequent transactions, particularly when additional selling interest appears and the market must absorb it.
Editor’s View: The Market Is Repricing Conviction, Not Just Bitcoin
Bitcoin’s realized price is frequently treated as a single measure of market health. Its more important contribution is showing why participants facing the same market price can make very different decisions.
An investor sitting on substantial unrealized gains may view a recovery as an opportunity to rebalance. Another holding a loss may welcome the same price because it offers a chance to recover capital. Neither response is captured adequately by aggregate profitability alone.
October 2026 illustrates this limitation. Bitcoin traded well above its estimated network cost basis, yet recently active holders still transferred substantial profitable supply to exchanges during an earlier recovery.
The average holder’s position did not determine the behaviour of those prepared to transact.
There is also a structural consequence that conventional price analysis can miss. As coins change hands, the market’s ownership composition can evolve even while Bitcoin remains within the same trading range.
A future encounter with an apparently familiar price may therefore involve different investors, different exposure, and different selling incentives.
This is the central value of cost-basis analysis. It helps explain the financial history influencing participants’ decisions, while spending activity and execution conditions determine which incentives become visible in the market.
A profitable holder is not necessarily committed to holding, and a lower aggregate cost basis does not guarantee stronger demand.
Bitcoin’s realized price is therefore most useful as a framework for understanding potential market pressure, not as a mechanical guide to where the market must turn.
Price records the latest agreement between buyers and sellers. Cost basis reveals the financial history that may influence their next disagreement.

