
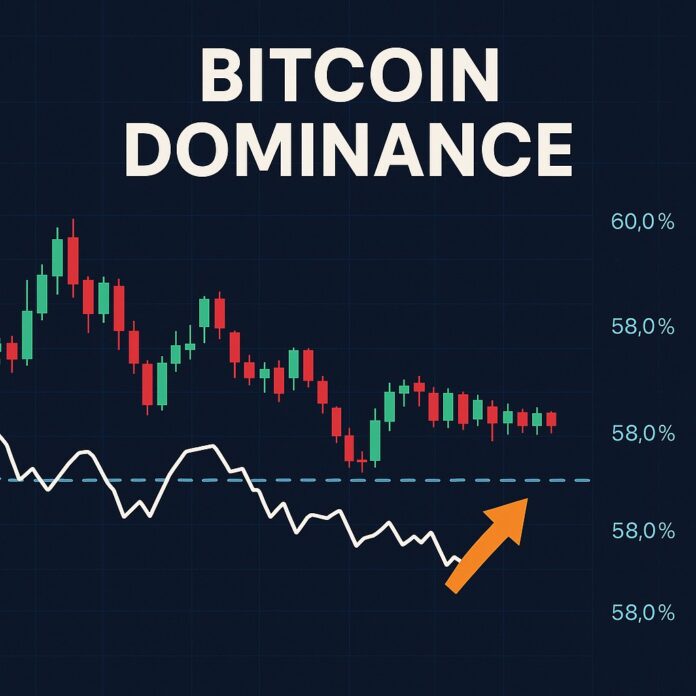
The Bitcoin dominance chart has been one of the most widely used tools for traders looking to track and predict market trends. Historically, Bitcoin has dominated the cryptocurrency market in terms of market capitalization. However, recent signals from the Bitcoin dominance chart have traders on edge, as it shows signs that a major shift could be underway in the market. The question on many traders’ minds is: could altcoins soon start to gain more traction?
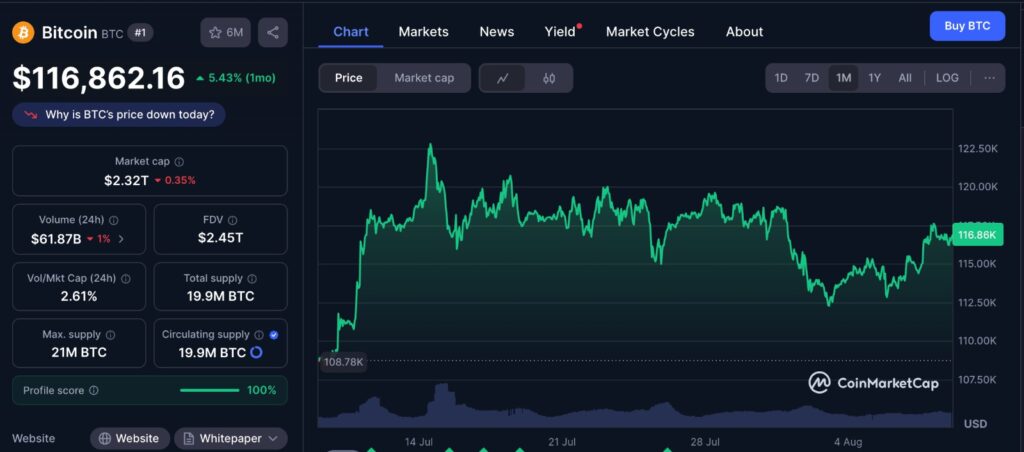
The chart above showcases the current price of Bitcoin (BTC) along with its performance over the past month. This price action highlights the fluctuations in Bitcoin’s dominance within the market, providing key insights into how Bitcoin is currently performing relative to other cryptocurrencies. The trend over the past month reflects investor sentiment and could offer crucial signals for upcoming market movements, especially as the Bitcoin dominance chart continues to show signs of potential shifts in market dynamics.
Understanding Bitcoin Dominance and Its Significance
Bitcoin dominance refers to the proportion of Bitcoin’s market capitalization compared to the total market capitalization of all cryptocurrencies. In simpler terms, it’s a measure of Bitcoin’s dominance in the crypto market relative to altcoins like Ethereum, Solana, and others. As Bitcoin’s market dominance rises, it generally signals that Bitcoin is outperforming other cryptocurrencies. Conversely, when Bitcoin’s dominance falls, it suggests that altcoins are starting to gain more interest and see more substantial price movements.
The Bitcoin dominance chart can help traders gauge whether it’s time to enter altcoins or stay with Bitcoin. When Bitcoin dominance rises, it’s often seen as a sign to stick with Bitcoin, while a falling dominance could signal that it’s time to start diversifying into altcoins. As the market continues to evolve, these shifts in dominance become even more important to track.
Recent Trends in Bitcoin Dominance
Over the past few months, the Bitcoin dominance chart has been fluctuating within a narrow range between 58% and 60%. This consolidation phase has raised questions among market participants about the potential direction of the market. A range-bound market usually signals indecision, with neither the bulls nor the bears fully in control. Such periods of indecision often precede significant market movements, which makes the current behavior of the Bitcoin dominance chart an important signal to watch.
Bitcoin’s dominance is currently sitting around the 59% mark, signaling a delicate balance between the two forces of market sentiment. If Bitcoin’s dominance breaks above 60%, it could suggest that Bitcoin is gaining more traction and could start outperforming altcoins once again. On the other hand, if Bitcoin’s dominance continues to fall below 58%, it may signal the beginning of an altcoin rally, where altcoins could see significant gains as investors shift their focus.
Implications for Traders
For traders, the Bitcoin dominance chart offers several insights that can help inform trading strategies. In particular, it can provide early warnings about potential market shifts. With Bitcoin dominance hovering between 58% and 60%, traders should be cautious. Although Bitcoin is still the market leader, the recent decline in dominance could indicate that altcoins are gearing up for a period of growth. Traders should be mindful of this and watch the Bitcoin dominance chart closely to identify any breakout or breakdown that could signal a change in market direction.
If Bitcoin’s dominance continues to weaken, traders with higher risk tolerance might start diversifying their portfolios into altcoins. With many altcoins already showing promising growth, diversifying now could yield profitable returns if an altcoin rally follows. However, traders who are risk-averse might choose to wait for a clear breakout in either direction before making their move.
Key Support and Resistance Levels to Watch
When analyzing the Bitcoin dominance chart, it’s important to identify key levels of support and resistance. Currently, the main resistance level is around 60%. If Bitcoin’s dominance breaks through this level, it could suggest that Bitcoin will continue to gain strength against the altcoins. On the flip side, the 58% mark serves as a strong support level. A break below this level could mark the beginning of an altcoin rally, which traders will want to take advantage of.
If Bitcoin’s dominance continues to decline, altcoins like Ethereum, Solana, and Binance Coin could start gaining more market share, leading to a broader altcoin rally. It is crucial for traders to monitor these levels and act quickly if a breakout or breakdown occurs. As Bitcoin’s dominance fluctuates, it’s also essential to consider the overall market conditions, including macroeconomic factors, regulatory developments, and investor sentiment, which can all influence market behavior.
What This Shift Means for Altcoins
As the Bitcoin dominance chart shows signs of weakening, the market might be entering a phase where altcoins begin to outperform Bitcoin. Over the past few weeks, many altcoins have been gaining traction, showing impressive growth despite Bitcoin’s relatively stable price action. This shift in market behavior could be the beginning of an “altseason,” where altcoins experience significant price appreciation.
Altcoins such as Ethereum, Solana, and others could potentially see increased interest as traders shift their focus from Bitcoin to these emerging assets. The growth of decentralized finance (DeFi), non-fungible tokens (NFTs), and the increasing adoption of blockchain technology are key factors driving the rise of altcoins. As more capital flows into altcoins, their market share could continue to grow, resulting in a decline in Bitcoin’s dominance.
Long-Term Outlook: What to Expect from Bitcoin and Altcoins
Looking ahead, the Bitcoin dominance chart will likely remain a critical indicator for traders looking to predict market trends. A sustained decline in Bitcoin dominance could indicate that altcoins are primed for growth, while an increase in dominance could signal that Bitcoin is on the verge of a new bullish phase. As the market continues to evolve, it’s crucial for traders to stay adaptable and monitor the Bitcoin dominance chart for signals of what’s to come.
Ultimately, the decision to hold Bitcoin or diversify into altcoins depends on the broader market dynamics and individual risk tolerance. However, one thing is clear – the Bitcoin dominance chart will continue to be a valuable tool for understanding market trends and making informed trading decisions.
Conclusion
The Bitcoin dominance chart is at a critical juncture, signaling potential shifts in market dynamics. Traders must remain vigilant and watch for breakout or breakdown signals, as these movements could have significant implications for both Bitcoin and altcoins. Whether you are a Bitcoin holder or a fan of altcoins, understanding the trends shown in the Bitcoin dominance chart can help you make more informed trading decisions.
Suggested Links
Keep yourself updated with the latest crypto analysis with Blockbuzzed
Keep yourself updated with the latest news around Altcoins with Blockbuzzed
Keep yourself updated with the latest news around memecoins with Blockbuzzed
Keep yourself updated with the latest news around Ethereum with Blockbuzzed
Keep yourself updated with the latest news around Bitcoin with Blockbuzzed

